
Observability
Watch a Hubzoid deployment through usage and cost in the Console, tool decisions with hubzoid audit, OpenTelemetry traces, logs and health checks.
Hubzoid records what operators need in its own operational store: usage for every chat turn and workflow model call, every restricted tool decision, and every access change. The Console and the CLI read those tables directly, so the numbers are the same whichever chat app fronts the agents. Traces to an external backend are optional and off by default.
When to use this
Use this page to set up monitoring for a deployment, to answer "who used what and what did it cost", and to investigate a refused tool call or a failed run. For the Console screens themselves, see the Console overview.
What Hubzoid records
| Record | Table | Contents | Read it with |
|---|---|---|---|
| Usage | hz_usage | Time, hub, surface, user, chat, model, tokens, estimated cost, status and duration. No message content. | The Console's Agents page |
| Tool decisions | hz_access_decisions | Time, hub, user, surface, tool, decision and reason for every restricted tool call | hubzoid audit, the Console's Activity |
| Access changes | hz_access_audit | Who granted or revoked what, who added, approved or deleted a user, and schedule pause, resume and cancel actions | The Console's Activity |
| Runs | The workflow engine's database | Every scheduled and manual run with its steps, result and error | Each agent's Runs & schedules tab in the Console, hubzoid schedule status |
All four live in the deployment's own databases. Hubzoid keeps no second copy of run history and sends none of this anywhere.
Usage and cost
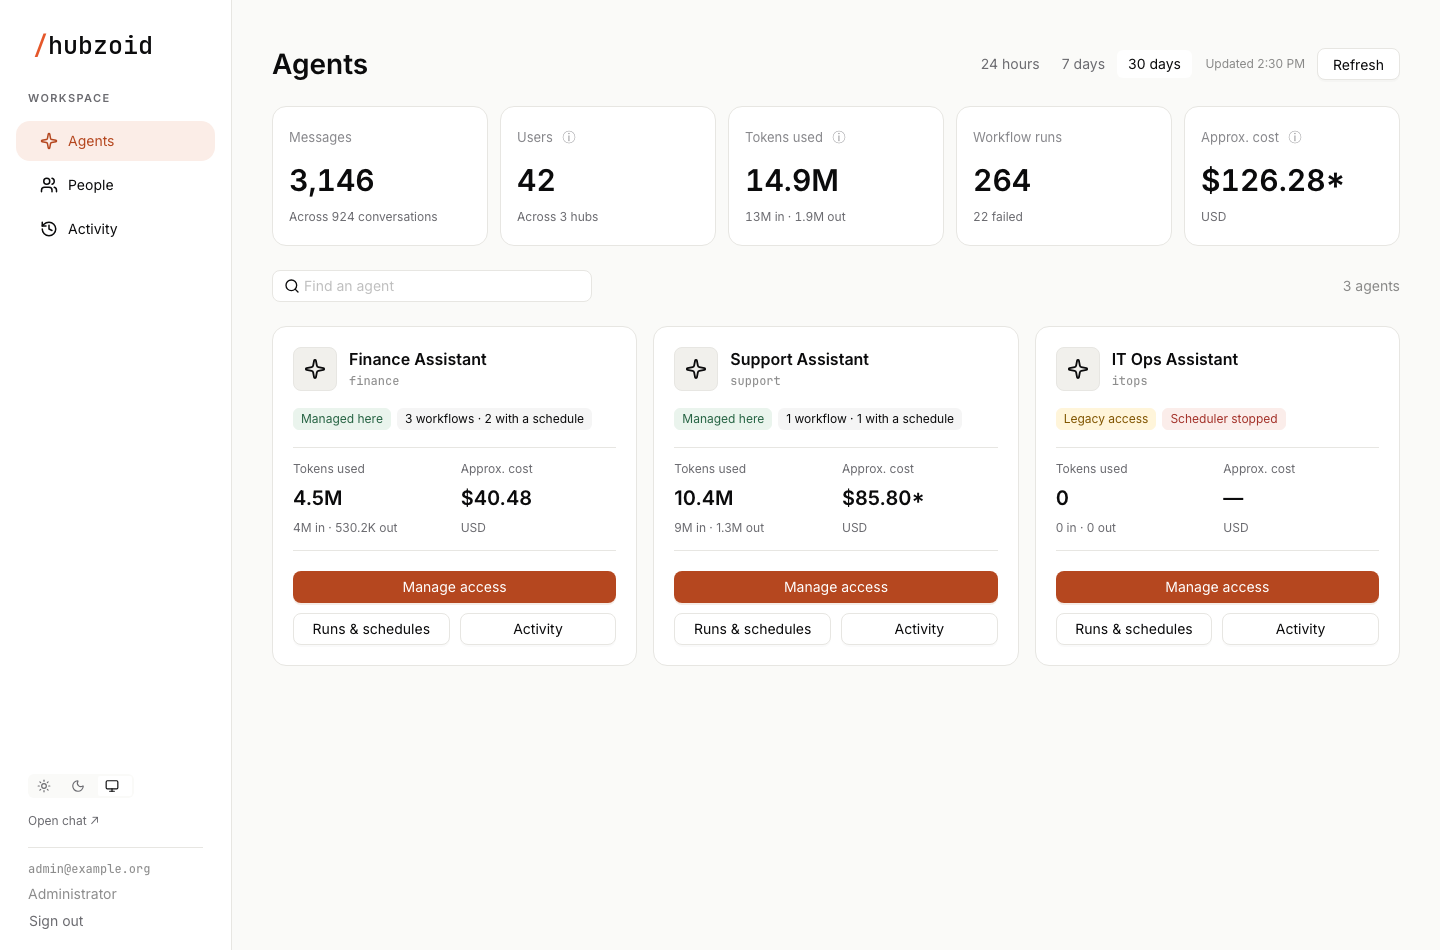
The Console opens on Agents: five totals for the last 24 hours, 7 days or 30 days, then one card per agent with its tokens and approximate cost for the same period. Agent administrators see only their agents.
| Number | Meaning |
|---|---|
| Messages | Chat messages on every chat surface, including Slack, WhatsApp and Telegram, with the number of conversations. Background title and suggestion calls are not counted. |
| Users | Sign-in accounts in the viewer's scope, whatever the period, read from the chat app's account directory. |
| Tokens used | Chat turns plus background calls, scheduled work and workflow model calls. |
| Workflow runs | Runs started in the period, with how many failed. |
| Approx. cost | In USD, from the model's reported cost or LiteLLM's price table. Calls with no known price are left out and marked with *. |
A figure Hubzoid cannot know reads Unavailable or a dash, never zero. Refused tool calls are listed under Activity as Tool decisions with the outcome Denied, and missed code workflow runs show on each agent's Runs & schedules tab. See the Console overview.
Tool decisions
Every call to a restricted tool is checked in code and written as one row, allowed or denied. A call whose row cannot be written is refused, so every call that ran is in the log. The chat app never sees tool calls, so this log is the only record of them.
hubzoid audit ./finance                    # the 50 most recent decisions
hubzoid audit ./finance --denied           # refusals only
hubzoid audit ./finance --user priya@example.com -n 200| Option | Default | Effect |
|---|---|---|
--limit, -n | 50 | How many recent decisions to show |
--user | none | Only one person or service identity |
--denied | off | Only refused calls |
Each line shows the time, user, ALLOW or DENY, the tool, and the surface with a reason:
| Reason | Meaning |
|---|---|
grant | Allowed by a managed grant |
group | Allowed by a chat app group, on a hub that still uses group-based access |
no-grant, no-group | The caller lacks the permission |
anonymous | No verified identity reached the bridge |
surface:<name> | The surface may not reach restricted tools, for example surface:slack-channel |
blocked | The person's agent access is blocked |
store-error | The access store could not be read, so the call was denied |
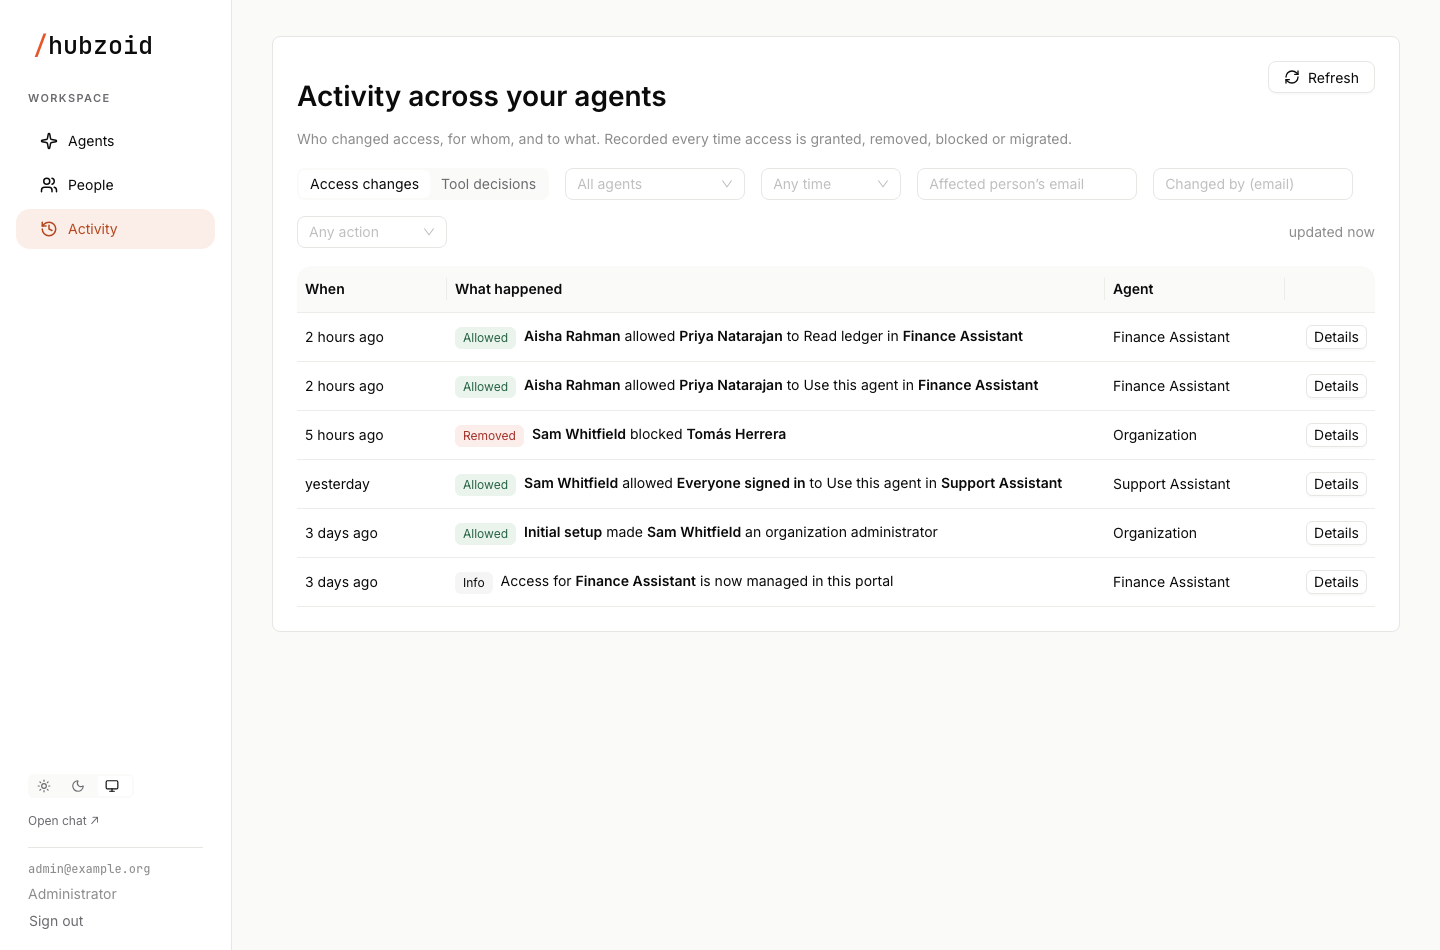
The Console's Activity page shows the same decisions under Tool decisions, and every grant, revoke and account change under Access changes, with filters for time, agent, person, tool, outcome and channel. Filters live in the URL, so a filtered view can be shared. See people and activity.
Scheduled runs
Each agent's Runs & schedules tab in the Console lists its workflows, who they run as, and every run with its status and steps. A run's result and step outputs are shown only to the account the run acted as, and other managers see a failure summary. The tab is read only. Control runs on the server:
hubzoid schedule status ./finance          # definitions, recent runs and errors
hubzoid schedule pause ./finance month-end
hubzoid schedule cancel ./finance <run-id>
hubzoid doctor reports scheduler.health: a hold set by a backup in progress, paused work, a failed dispatcher, or no recent dispatcher heartbeat. See operating runs.
OpenTelemetry traces
Hubzoid can push traces over OTLP/HTTP to any OpenTelemetry backend, such as Langfuse or an OpenTelemetry Collector. It is off until you set an endpoint in the hub's environment:
HUBZOID_OTEL_ENDPOINT=https://langfuse.internal/api/public/otel
OTEL_EXPORTER_OTLP_HEADERS=Authorization=Basic <base64 of public_key:secret_key>
OTEL_EXPORTER_OTLP_HEADERS is the standard exporter variable and passes straight through, for backends that need authentication. Emission is an outbound push. Nothing is added to the public port, so keep the receiver on a private network.
The spans come from the model SDKs. What they carry depends on the model path:
| Model path | What is emitted | Attribution |
|---|---|---|
| LiteLLM providers (OpenRouter, OpenAI, Azure, Anthropic and others) | LiteLLM's OpenTelemetry callback, with standard gen_ai.usage.* token attributes and gen_ai.cost.total_cost | hubzoid.hub as a resource attribute |
claude-local | Claude Code's trace spans (interaction, llm_request, tool) with token counts | hubzoid.user, hubzoid.hub, hubzoid.surface and user.id (the signed-in person) as resource attributes |
On the claude-local path Hubzoid sets these defaults for the Claude Code process, and a value you set yourself wins:
Prop
Type
Claude Code puts token counts under names Langfuse does not map, so cost shows as zero there. Set HUBZOID_OTEL_NORMALIZE=true to fix this inside the bridge, with no extra process: the bridge receives its own Claude Code spans on its loopback port, copies the token counts to the gen_ai.usage.* names, sets each span's user.id to the signed-in person, adds the hub name as a Langfuse tag so cost can be grouped by hub, and forwards the batch to HUBZOID_OTEL_ENDPOINT. It has no effect on the LiteLLM path. If you already run a shared collector, point HUBZOID_OTEL_ENDPOINT at it instead, leave normalization off, and use the reference configuration in docs/otel-collector.yaml (opens in a new tab).
Langfuse prices tokens from its own model table. A model it does not know yet shows tokens with zero cost until you add its price there.
In a gateway every hub runs its own bridge, so set HUBZOID_OTEL_ENDPOINT in each hub's .env, pointing at the same backend. Traces separate by hubzoid.hub.
Message content
On the claude-local path, prompt and response bodies stay out of spans unless you set OTEL_LOG_USER_PROMPTS=1 or OTEL_LOG_ASSISTANT_RESPONSES=1. On the LiteLLM path, spans are produced by LiteLLM's OpenTelemetry callback. Review what your backend receives before pointing a production hub at a shared or third-party backend.
Two related switches are separate from HUBZOID_OTEL_ENDPOINT. HUBZOID_OPENAI_TRACING=true lets the OpenAI Agents SDK export its own traces, including prompts and tool data, to OpenAI. It is off by default. Eval runs push one trace per case with scores to Langfuse when LANGFUSE_PUBLIC_KEY and LANGFUSE_SECRET_KEY are set (or read back from the Basic credentials in OTEL_EXPORTER_OTLP_HEADERS), tagged hubzoid.eval so you can filter them out. See evals.
Logs
| Source | Where |
|---|---|
| Hubzoid, bridge and edge | The process's standard output. Under systemd, journalctl -u hubzoid@<hub> -f. |
| The chat app | <hub>/.openwebui-data/openwebui.log, or <data-dir>/openwebui.log in a gateway |
| Slack adapter and inbound units | Their own units, for example journalctl -u hubzoid-slack@<hub> |
HUB_LOG_LEVEL sets the level for the bridge and edge: info (default), debug or warning.
Health checks
| Check | Where | Use it for |
|---|---|---|
GET /health | The public port, answered by the chat app through the edge | Liveness probes and uptime monitors |
GET /healthz | The bridge, on 127.0.0.1:<BRIDGE_PORT> only | Local checks that the bridge is up. Returns status, hub and agent. |
hubzoid doctor <hub> --json | The server | Configuration and state checks for scripts and monitoring |
Doctor reads only. It creates no database, runs no migration and starts no engine, so it is safe against a running deployment. It exits with status 1 when any check fails.
hubzoid doctor /opt/hubzoid/agents/finance --json{
"format": 1,
"hub": "/opt/hubzoid/agents/finance",
"hubzoid": "1.0.1",
"ok": true,
"checks": [
{ "id": "auth.bridge_keys", "status": "ok", "summary": "1 bridge key(s) set", "detail": null },
{ "id": "backup.age", "status": "warn", "summary": "No backup recorded. Run `hubzoid backup`.", "detail": null }
]
}Every check has a stable id and a status of ok, info, warn or fail. ok is false when any check fails. New checks may be added, and existing ids are never renamed, so alert on ids. The ones most useful for monitoring:
| Check | Watches |
|---|---|
db.operational, db.hub | Databases reachable and at the current schema |
scheduler.health | Scheduled work held, paused, failing or without a heartbeat |
backup.age | Warns when the last backup is more than 7 days old, or there is none |
auth.bridge_keys, auth.chat_signin, exposure.bind | Bridge keys set, sign-in on, and how the public port is bound |
model.credentials | Provider credentials present for the configured model |
deps.sqlite | SQLite new enough for the workflow engine |
The doctor reference lists every check.